架設 Promethues 監控 K8s 叢集並以 exporter 蒐集應用程式 metrics
本次 Lab 將簡單介紹 Prometheus 的架構,以及如何在 OpenStack 上的 K8s 叢集中快速架設 Prometheus 作為監控工具,並且架設 MongoDB 以及對應的 Exporter,讓 Prometheus 可以抓取到應用程式的 metrics,最後在 Grafana 上面呈現資訊。
此 Lab 需要先建立一個 Kubernetes 叢集,可透過 OpenStack 上的資源或 minikube 等。本次 Lab 的操作基於 OpenStack 上的 Kubernetes 叢集,由一個 Control Plane 和兩個 Worker Node 組成。
Prometheus 介紹
Prometheus 簡介及架構
Prometheus 在過去幾年逐漸變成監控工具的代名詞,不僅能用在雲端原生環境,也可用於傳統裸機部署環境。運用監控工具的優勢在於快速定位問題點,以往沒有監控概念的情況下,在現今漸趨複雜的微服務架構中,很難迅速找到錯誤的癥結點。而 Prometheus 正好可以解決這樣的痛點。
Prometheus 官方網站提供架構圖如下:
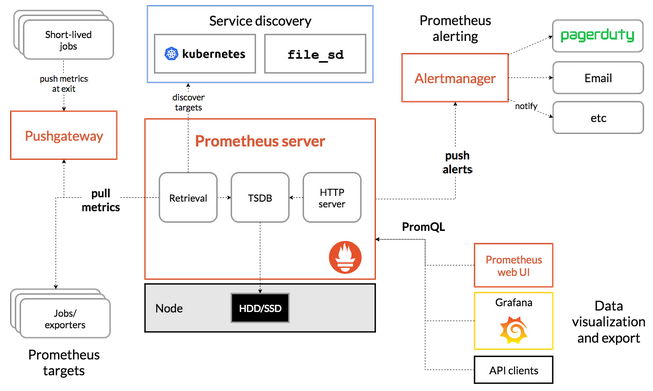
中間的 Prometheus server 就是其最核心的部分,負責執行實際的監控工作。核心包含三部分,依照資料傳輸流程,分別來看各個元件做了哪些事情:
- Retrieval: 監控工具理所當然的要有負責蒐集資料的元件,而在 Prometheus 中負責這件事的元件為 Retrieval,有固定的工作週期,負責向 target 拉取 (pull) metrics data,這個 target 可以是 K8s 叢集內的資源例如各個 applications、services、客製的 Exporter。Retrieval 拉取資料後再將其儲存到 TSDB。
- TSDB (Time Series Database): 透過 Retrieval 蒐集的資料需要有地方儲存,在 Prometheus 中是以時間序列型的資料庫來儲存 pull 得到的 metrics data,像是 CPU Usage 或 exception 數量等。
- HTTP Server: 而監控最終的目的還是需要提供查詢、視覺化的功能,而 HTTP Server 就是負責處理來自 Prometheus 本身的 Web UI、Grafana 或其他 API Client query 請求的伺服器。
- Pushgateway: 通常只用於不適合 pull 機制的場景,比如定期資料庫備份或 CI/CD Runner 在執行 build, test, deploy 的作業;這類型作業因屬非持續執行的 process,時間跨度過短,因此 Prometheus 也提供更適合此類型作業的 Push 機制。而由於 PushGateway 在監控多個實體時,可能成為單點故障或潛在瓶頸,且某種程度上也失去 Prometheus 自動監控各實體的設計,因此需相當注意使用時機。
- Prometheus Web UI: 預設的 GUI,提供透過 HTTP 並下 PromQL 語法查詢 metrics data 的方法。
- AlertManager: 顧名思義,負責在觸發告警規則時發送訊息給使用者,管道多元,包含 e-mail、Discord、Slack 等。
Metrics 種類
在談可觀測性 (Observability) 的時候不免會提到三本柱 Metric (指標)、Log (日誌)、Trace (追蹤),而其中 Prometheus 提供的就是 Metrics 的資訊,實際資料內容大概會像這樣:
# HELP collector_scrape_time_ms Time taken for scrape by collector
# TYPE collector_scrape_time_ms gauge
collector_scrape_time_ms{collector="diagnostic_data",exporter="mongodb"} 136
collector_scrape_time_ms{collector="general",exporter="mongodb"} 0
collector_scrape_time_ms{collector="replset_status",exporter="mongodb"} 0
# HELP go_gc_duration_seconds A summary of the pause duration of garbage collection cycles.
# TYPE go_gc_duration_seconds summary
go_gc_duration_seconds{quantile="0"} 2.2998e-05
go_gc_duration_seconds{quantile="0.25"} 6.0768e-05
go_gc_duration_seconds{quantile="0.5"} 7.5658e-05
go_gc_duration_seconds{quantile="0.75"} 9.0277e-05
go_gc_duration_seconds{quantile="1"} 0.000573308
go_gc_duration_seconds_sum 0.916284376
go_gc_duration_seconds_count 10404
其中 TYPE 與 HELP 欄位作為註解用,提升可讀性,HELP 主要是該段 metrics 的註解,而 TYPE 欄位會顯示該筆資料是什麼類型的 metrics。目前 Prometheus 提供 4 種類型的 metrics:
- Counter: 累計型的數值,僅能增加或在重啟時歸零,適合用來表示收到的 request 數量、完成任務數量、發生 error 次數等需要追蹤事件發生的總次數的場景。
- Gauge: 可任意上升或下降的數值指標,可用來表示 CPU 溫度、記憶體用量等。
- Histogram: 直方圖類型,可表示樣本的分佈情形,像是不同 request response time 區間統計。
- Summary: 類似直方圖,但額外提供百分位數的計算。
關於 4 種 metrics type 的詳細介紹可參考 Metrics Type。
Pull Mechanism
Prometheus 與其他監控系統不同在於獲取資料的方式。以 AWS Cloud Watch 為例,是由系統中各個 application 或 server 主動推送 metrics 到 Cloud Watch 中心化的平台,這樣的缺點是網路負載高,進一步造成監控系統反而可能會成為服務的瓶頸,另外這樣的方式也需要 application 或 server 在底層額外安裝 daemon 去 push metrics 給上述服務。
而 Prometheus 採用的是 Pull 的機制,它會主動去拉取各個服務的 metrics,對於監控來說,這樣可以更好定位問題點的發現,因為以 push 機制來說,只要被監控的服務本身出問題,就不會推送通知到監控系統中;換言之用 pull 的方式只要 Prometheus 自身正常運作,就可以正常監控到各個服務的狀態。
在 Kubernetes 上架設 Prometheus
簡單介紹完 Prometheus 之後,就來實際架設並瞭解 Prometheus 如何運作。操作之前,請確認你已經在 OpenStack 上有一座多節點的 Kubernetes 叢集,並可以透過 "Helm" 來操作叢集內的資源。
Helm 的安裝,請參考 Installing Helm。
首先先透過 Helm 將本次 lab 要使用的 kube-prometheus-stack 的 Helm Chart 加入:
helm repo add prometheus-community https://prometheus-community.github.io/helm-charts
helm repo update
因為後續會用到 exporter 來抓取資料,在實際安裝前需要先更改預設 values.yaml 中的一些設定:
helm show values prometheus-community/kube-prometheus-stack --version 51.6.0 > values.yaml
其中需要改的有下列:
.prometheus.serviceMonitorSelectorNilUsesHelmValues改為false。.grafana.defaultDashboardsTimezone改為Asia/Taipei。.prometheus.prometheusSpec.retentionTime改為空字串""。.grafana.adminPassword可自行更改。
實務上,由於 Prometheus 本質上有儲存資料的功能 (儲存 Metrics Data 的 Time Series Database),而在 Kubernetes 中要做到儲存資料需要用到 PV 及 PVC。在 OpenStack 的環境中,會需要用到 Cinder CSI 去做到掛載雲端硬碟作為儲存空間的功能,並在 Prometheus 的 values.yaml 中更改 .prometheus.prometheusSpec.storageSpec 的設定;本次 Lab 將不額外說明這部分的設定,預設採用 Kubernetes 中 emptyDir 作為 volume,意即這些 metrics data 將直接儲存在 Pod 中,但 Pod 死亡後資料不會儲存,作為實驗性質的操作。詳細可參考 Storage of Prometheus Operator
完成之後,就可以接著安裝 Prometheus Operator:
helm install prometheus-stack prometheus-community/kube-prometheus-stack -f values.yaml -n prometheus-stack --version 51.6.0
順利安裝的話會看到下列資訊:
NAME: prometheus-stack
LAST DEPLOYED: Sat Feb 17 10:00:26 2024
NAMESPACE: prometheus-stack
STATUS: deployed
REVISION: 1
NOTES:
kube-prometheus-stack has been installed. Check its status by running:
  kubectl --namespace prometheus-stack get pods -l "release=prometheus-stack"

Visit https://github.com/prometheus-operator/kube-prometheus for instructions on how to create & configure Alertmanager and Prometheus instances using the Operator.
確認安裝的服務皆成功啟動(然後用 kubectl -n prometheus-stack get all -l "release=prometheus-stack" 確認):
NAME                                                         READY   STATUS    RESTARTS   AGE
pod/alertmanager-prometheus-stack-kube-prom-alertmanager-0   2/2     Running   0          6h22m
pod/prometheus-prometheus-stack-kube-prom-prometheus-0       2/2     Running   0          6h22m
pod/prometheus-stack-grafana-66f8959fdc-qg7sh                3/3     Running   0          6h22m
pod/prometheus-stack-kube-prom-operator-59b78bf746-mlgpw     1/1     Running   0          6h22m
pod/prometheus-stack-kube-state-metrics-5fc6bbc456-wb8gr     1/1     Running   0          6h22m
pod/prometheus-stack-prometheus-node-exporter-8zxcz          1/1     Running   0          6h22m
pod/prometheus-stack-prometheus-node-exporter-dgdt5          1/1     Running   0          6h22m
pod/prometheus-stack-prometheus-node-exporter-vccmt          1/1     Running   0          6h22m

NAME                                                TYPE        CLUSTER-IP       EXTERNAL-IP   PORT(S)                      AGE
service/alertmanager-operated                       ClusterIP   None             <none>        9093/TCP,9094/TCP,9094/UDP   6h22m
service/prometheus-operated                         ClusterIP   None             <none>        9090/TCP                     6h22m
service/prometheus-stack-grafana                    ClusterIP   10.97.26.58      <none>        80/TCP                       6h22m
service/prometheus-stack-kube-prom-alertmanager     ClusterIP   10.98.7.168      <none>        9093/TCP,8080/TCP            6h22m
service/prometheus-stack-kube-prom-operator         ClusterIP   10.96.160.59     <none>        443/TCP                      6h22m
service/prometheus-stack-kube-prom-prometheus       ClusterIP   10.108.206.139   <none>        9090/TCP,8080/TCP            6h22m
service/prometheus-stack-kube-state-metrics         ClusterIP   10.109.99.167    <none>        8080/TCP                     6h22m
service/prometheus-stack-prometheus-node-exporter   ClusterIP   10.102.147.213   <none>        9100/TCP                     6h22m

NAME                                                       DESIRED   CURRENT   READY   UP-TO-DATE   AVAILABLE   NODE SELECTOR            AGE
daemonset.apps/prometheus-stack-prometheus-node-exporter   3         3         3       3            3           kubernetes.io/os=linux   6h22m

NAME                                                  READY   UP-TO-DATE   AVAILABLE   AGE
deployment.apps/prometheus-stack-grafana              1/1     1            1           6h22m
deployment.apps/prometheus-stack-kube-prom-operator   1/1     1            1           6h22m
deployment.apps/prometheus-stack-kube-state-metrics   1/1     1            1           6h22m

NAME                                                             DESIRED   CURRENT   READY   AGE
replicaset.apps/prometheus-stack-grafana-66f8959fdc              1         1         1       6h22m
replicaset.apps/prometheus-stack-kube-prom-operator-59b78bf746   1         1         1       6h22m
replicaset.apps/prometheus-stack-kube-state-metrics-5fc6bbc456   1         1         1       6h22m

NAME                                                                    READY   AGE
statefulset.apps/alertmanager-prometheus-stack-kube-prom-alertmanager   1/1     6h22m
statefulset.apps/prometheus-prometheus-stack-kube-prom-prometheus       1/1     6h22m
確認所有資源都正常顯示 Running 後,可以進一步來看 Grafana 以及 Prometheus 的介面:
kubectl port-forward service/prometheus-stack-kube-prom-prometheus 9090 -n prometheus-stack
kubectl port-forward service/prometheus-stack-grafana 8080:80 -n prometheus-stack
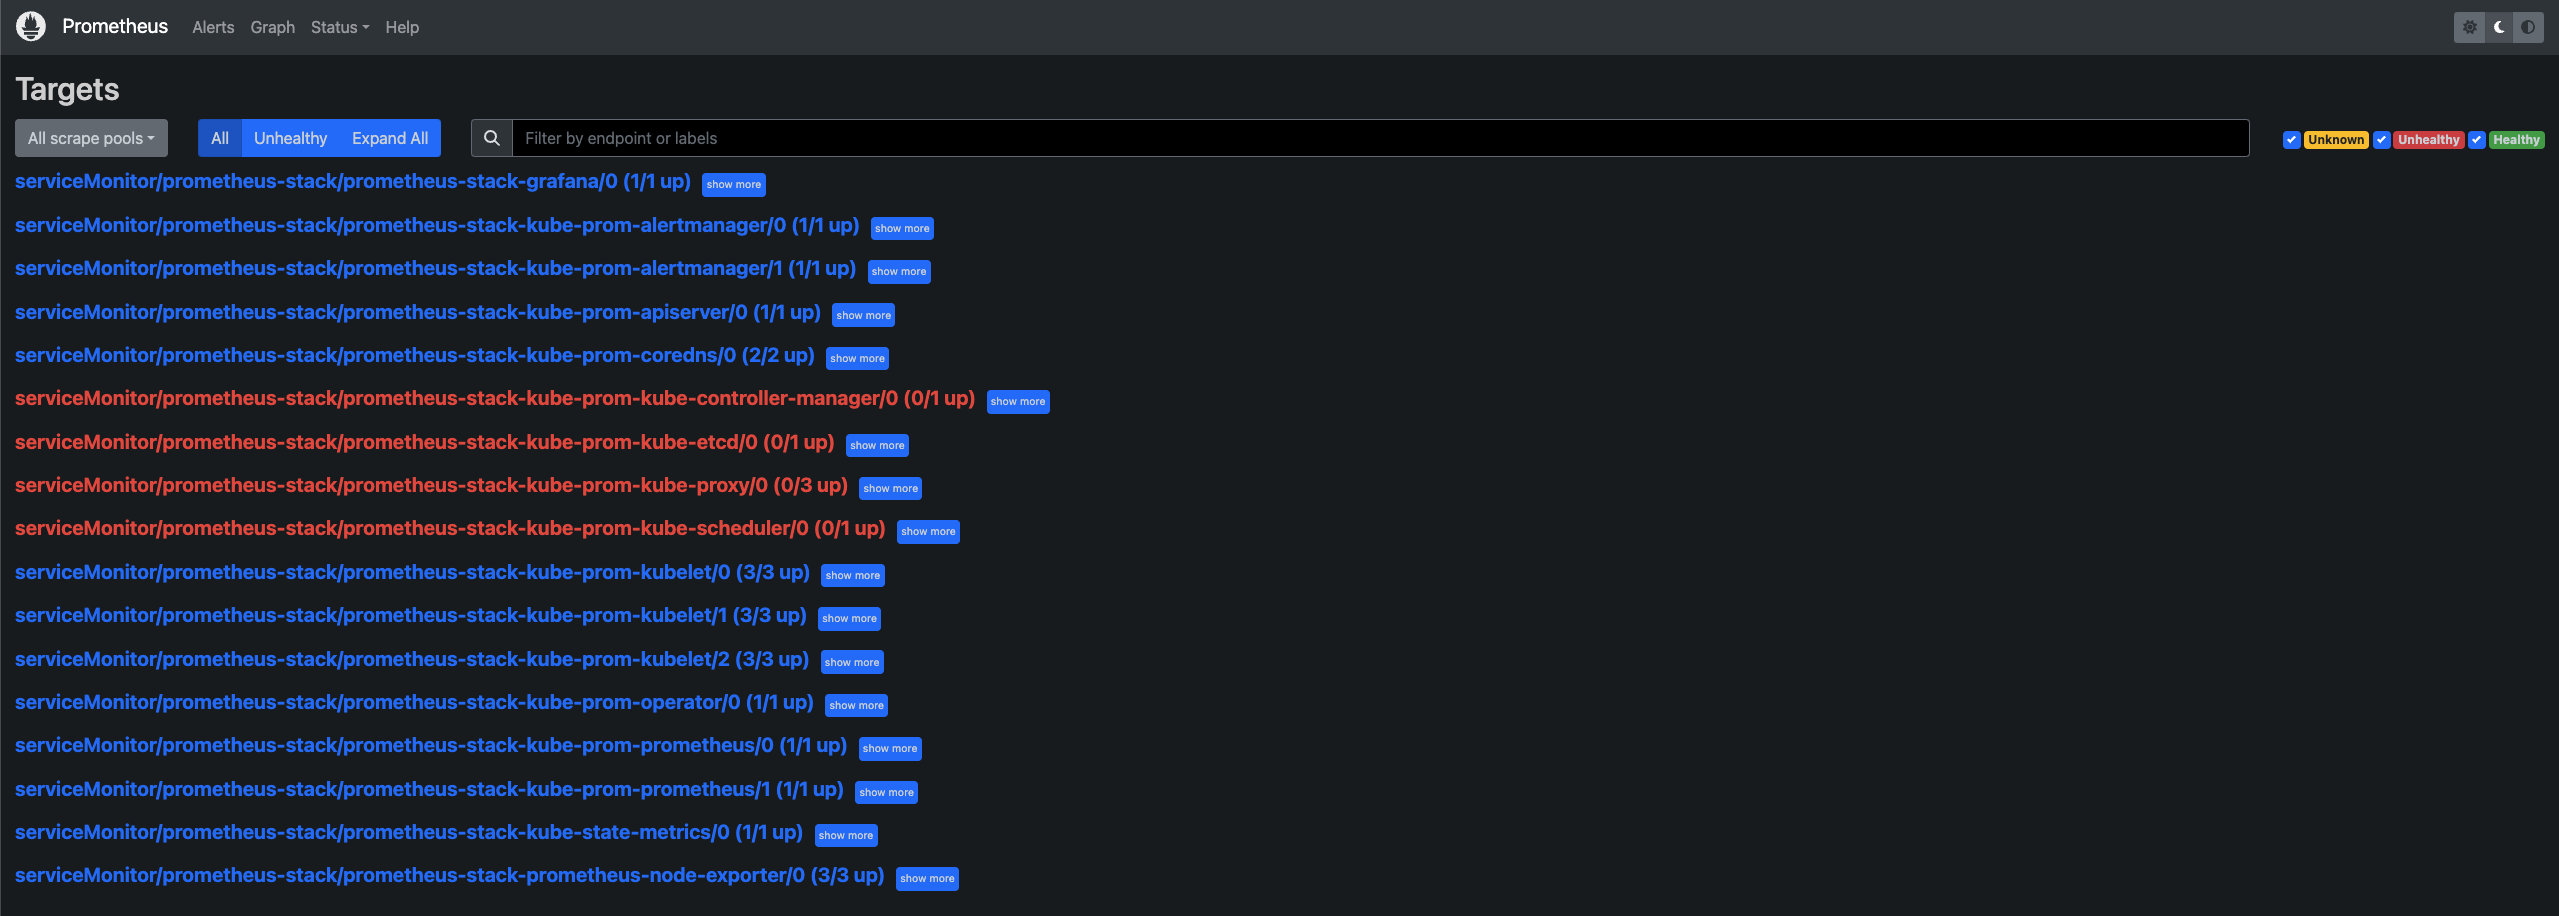
在本地端瀏覽器打開 localhost:9090 就可以看到 Prometheus 的介面:
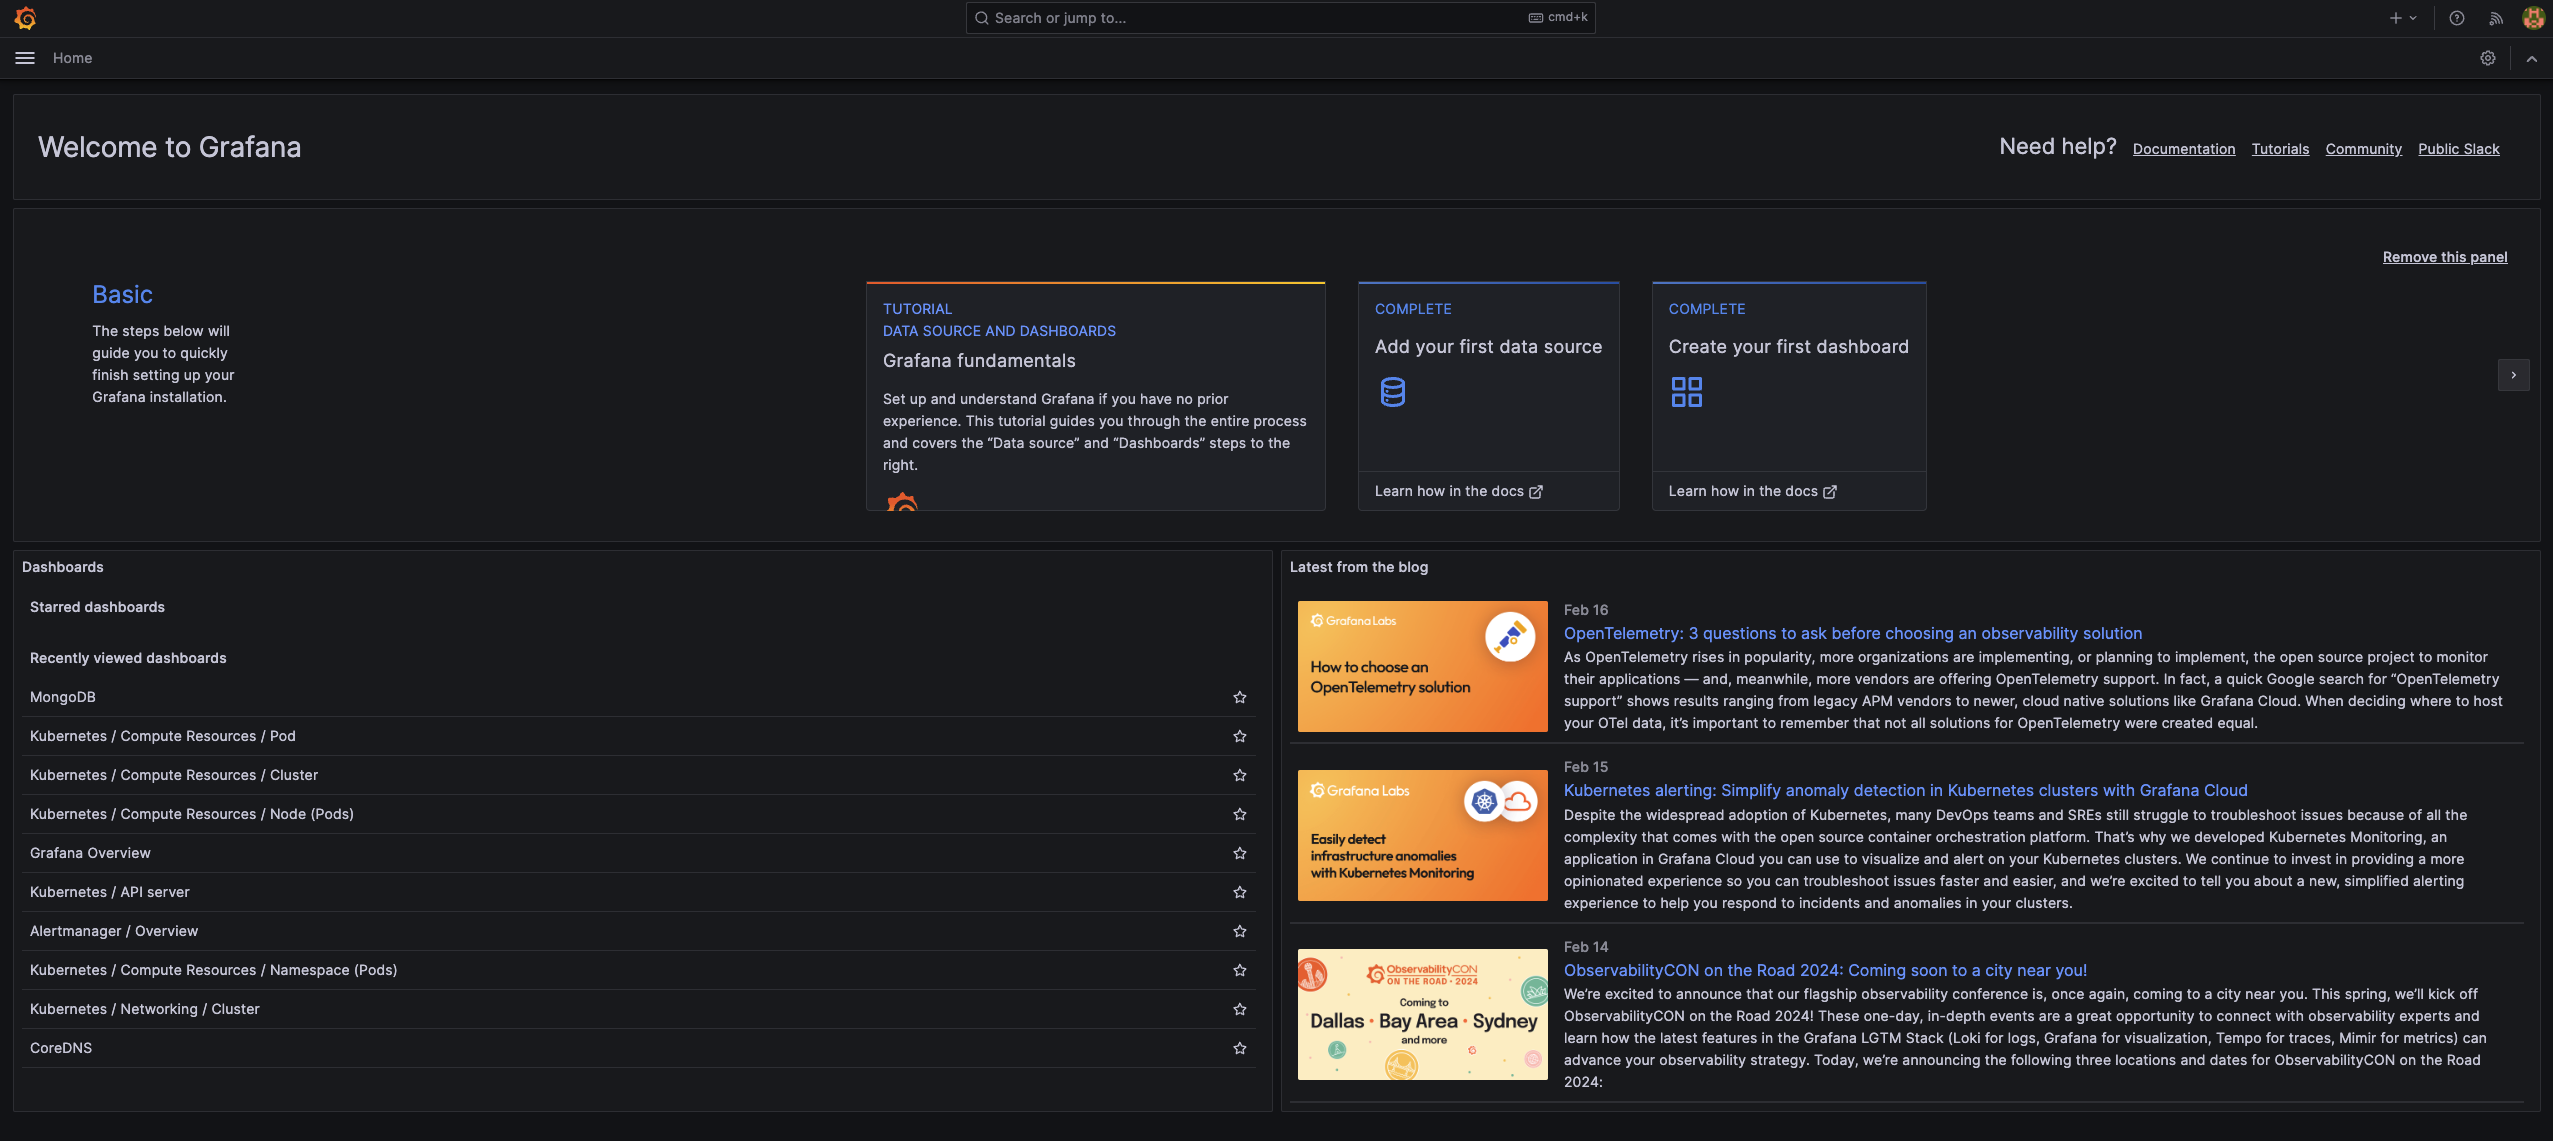
而 localhost:8080 則可以看到 Grafana 的介面:
Service Discovery
安裝了上述資源,透過 UI 也觀察到目前 Prometheus 可以監控我們的 K8s 叢集,那有沒有想過 Prometheus 到底是怎麼做到這件事的呢?又為什麼前面的設定中,.prometheus.prometheusSpec.serviceMonitorSelectorNilUsesHelmValues 要改為 false 呢?接下來就淺談 Prometheus 服務發現 (Service Discovery) 的機制。
由於本次 Lab 使用 Prometheus Operator 來安裝 Prometheus,所以其實除了上述資源,Operator 實際上在背後安裝許多 Custom Resource Definition (CRD),而其中�用來作為 Prometheus 發現並抓取服務 metrics data 的關鍵 resource 就是 ServiceMonitor。
我們可以透過 kubectl get crd 來看目前叢集中有哪些 CRD:
NAME                                        CREATED AT
alertmanagerconfigs.monitoring.coreos.com   2024-02-01T20:10:53Z
alertmanagers.monitoring.coreos.com         2024-02-01T20:10:53Z
podmonitors.monitoring.coreos.com           2024-02-01T20:10:53Z
probes.monitoring.coreos.com                2024-02-01T20:10:53Z
prometheusagents.monitoring.coreos.com      2024-02-01T20:10:54Z
prometheuses.monitoring.coreos.com          2024-02-01T20:10:54Z
prometheusrules.monitoring.coreos.com       2024-02-01T20:10:54Z
scrapeconfigs.monitoring.coreos.com         2024-02-01T20:10:54Z
servicemonitors.monitoring.coreos.com       2024-02-01T20:10:54Z
thanosrulers.monitoring.coreos.com          2024-02-01T20:10:54Z
可以看到 servicemonitors.monitoring.coreos.com 確實存在於叢集中。但要看 Prometheus 是以什麼規則來選擇 ServiceMonitor,則要看 prometheuses.monitoring.coreos.com 這個 CRD。
用 kubectl get prometheuses.monitoring.coreos.com -oyaml -n prometheus-stack 看裡面的設定:
apiVersion: v1
items:
- apiVersion: monitoring.coreos.com/v1
  kind: Prometheus
  metadata:
    annotations:
      meta.helm.sh/release-name: prometheus-stack
      meta.helm.sh/release-namespace: prometheus-stack
    creationTimestamp: "2024-02-17T10:00:38Z"
    generation: 1
    labels:
      app: kube-prometheus-stack-prometheus
      app.kubernetes.io/instance: prometheus-stack
      app.kubernetes.io/managed-by: Helm
      app.kubernetes.io/part-of: kube-prometheus-stack
      app.kubernetes.io/version: 51.6.0
      chart: kube-prometheus-stack-51.6.0
      heritage: Helm
      release: prometheus-stack
    name: prometheus-stack-kube-prom-prometheus
    namespace: prometheus-stack
    resourceVersion: "3885062"
    uid: 6b3e20bf-43bc-4d4a-8317-05cd763d2838
  spec:
    alerting:
      alertmanagers:
      - apiVersion: v2
        name: prometheus-stack-kube-prom-alertmanager
        namespace: prometheus-stack
        pathPrefix: /
        port: http-web
    enableAdminAPI: false
    evaluationInterval: 30s
    externalUrl: http://prometheus-stack-kube-prom-prometheus.prometheus-stack:9090
    hostNetwork: false
    image: quay.io/prometheus/prometheus:v2.47.1
    listenLocal: false
    logFormat: logfmt
    logLevel: info
    paused: false
    podMonitorNamespaceSelector: {}
    podMonitorSelector:
      matchLabels:
        release: prometheus-stack
    portName: http-web
    probeNamespaceSelector: {}
    probeSelector:
      matchLabels:
        release: prometheus-stack
    replicas: 1
    retention: ""
    routePrefix: /
    ruleNamespaceSelector: {}
    ruleSelector:
      matchLabels:
        release: prometheus-stack
    scrapeConfigNamespaceSelector: {}
    scrapeConfigSelector:
      matchLabels:
        release: prometheus-stack
    scrapeInterval: 30s
    securityContext:
      fsGroup: 2000
      runAsGroup: 2000
      runAsNonRoot: true
      runAsUser: 1000
      seccompProfile:
        type: RuntimeDefault
    serviceAccountName: prometheus-stack-kube-prom-prometheus
    serviceMonitorNamespaceSelector: {}
    serviceMonitorSelector: {}
    shards: 1
    tsdb:
      outOfOrderTimeWindow: 0s
    version: v2.47.1
    walCompression: true
  status:
    availableReplicas: 1
    conditions:
    - lastTransitionTime: "2024-02-17T10:02:30Z"
      observedGeneration: 1
      status: "True"
      type: Available
    - lastTransitionTime: "2024-02-17T10:02:30Z"
      observedGeneration: 1
      status: "True"
      type: Reconciled
    paused: false
    replicas: 1
    shardStatuses:
    - availableReplicas: 1
      replicas: 1
      shardID: "0"
      unavailableReplicas: 0
      updatedReplicas: 1
    unavailableReplicas: 0
    updatedReplicas: 1
kind: List
metadata:
  resourceVersion: ""
其中第 71 行的 .spec.serviceMonitorSelector 就是 Prometheus 選擇要註冊哪些 ServiceMonitor 的規則,目前的規則為空 ( {} ),代表任何 ServiceMonitor 都會被 Prometheus 給註冊用來抓取服務的 metrics data。
而為什麼這裡的設定會是 {} 呢?回到前述提到在更改 Prometheus 的 values.yaml 時,.prometheus.prometheusSpec.serviceMonitorSelectorNilUsesHelmValues 改為 false 的設定正與此相關。我們來看 values.yaml 該段設定的詳細內容:
prometheus:
  ...
  prometheusSpec:
    ...
    ## If true, a nil or {} value for prometheus.prometheusSpec.serviceMonitorSelector will cause the
    ## prometheus resource to be created with selectors based on values in the helm deployment,
    ## which will also match the servicemonitors created
    ##
    serviceMonitorSelectorNilUsesHelmValues: false

    ## ServiceMonitors to be selected for target discovery.
    ## If {}, select all ServiceMonitors
    ##
    serviceMonitorSelector: {}
    ## Example which selects ServiceMonitors with label "prometheus" set to "somelabel"
    # serviceMonitorSelector:
    #   matchLabels:
    #     prometheus: somelabel
可以發現註解有提到若 .prometheus.prometheusSpec.serviceMonitorSelectorNilUsesHelmValues 值為 true,而且 .prometheus.prometheusSpec.serviceMonitorSelector 值如果為 nil 或 {},則後續透過 Helm 安裝的應用程式就會基於其預設的 serviceMonitorSelector 的值去建立該應用程式以及對應的 ServiceMonitor。
而如果要忽略限制,讓 serviceMonitorSelector 值為 {} 以選擇註冊所有的 ServiceMonitor,則必須讓前面的 serviceMonitorSelectorNilUsesHelmValues 值改為 false 才能使 If {}, select all ServiceMonitors 的條件成立 (參考原 Chart template 的條件判斷)。
實務上也可以維持 serviceMonitorSelectorNilUsesHelmValues 為 true,然後去設定 serviceMonitorSelector 的 matchLabels 的值,並在之後安裝的應用程式也撰寫相同的 matchLabels。此 Lab 為快速 Demo,採取直接選取所有 ServiceMonitor 的做法。
安裝 MongoDB 與其 Exporter
什麼是 Exporter?
在安裝之前,先淺談在 Prometheus 的監控系統中為何需要 Exporter 以及什麼是 Exporter。
前面有提到 Metrics Data 有特定的格式,Exporter 所做的事就是去抓取應用程式的資料,轉譯成符合 Prometheus 要求的格式,並且 expose /metrics 的端點讓 Prometheus 的 Retrieval 可以抓到 exporter 所轉譯的 metrics data。而 Exporter 本身通常也會是一個 Pod 或 Container,跟它負責抓取的應用程式本身是解耦的。
以預設的 node-exporter 來說,它所做的事就是去抓取各個 Node (以 OpenStack 來說就是各台虛擬主機)的 CPU Usage、Disk Utilization、Memory Usage 等數值,並轉譯成前面提過的 Prometheus 專屬的格式,並 expose /metrics 端點讓 Prometheus Retrieval 可以去抓到對應的 metrics data。
實際部署
了解 Prometheus 服務發現的機制以及 Exporter 後,接下來將以 MongoDB 為例,實際部署 MongoDB 以及其 Exporter 到叢集中,並驗證 Prometheus 能否順利自動抓取到 MongoDB Exporter 所提供的 metrics data。
首先將 MongoDB 的 Repo 加入:
helm repo add bitnami https://charts.bitnami.com/bitnami
helm repo update
接下來把 MongoDB 預設的 values.yaml 輸出成檔案來更改設定:
helm show values bitnami/mongodb > mongodb.yaml --version 14.8.0
要更改的地方有:
.persistence.enabled改為false。.metrics.enabled改為true.metrics.serviceMonitor.enabled改為true.metrics.serviceMonitor.namespace改為"prometheus-stack".metrics.prometheusRule.enabled改為true
安裝 MongoDB 預設是不會啟用 exporter container 的,更改 .metrics 底下的設定就是為了啟用 exporter。接下來就實際安裝 MongoDB 與其 Exporter:
helm install mongodb bitnami/mongodb -f mongodb.yaml --version 14.8.0
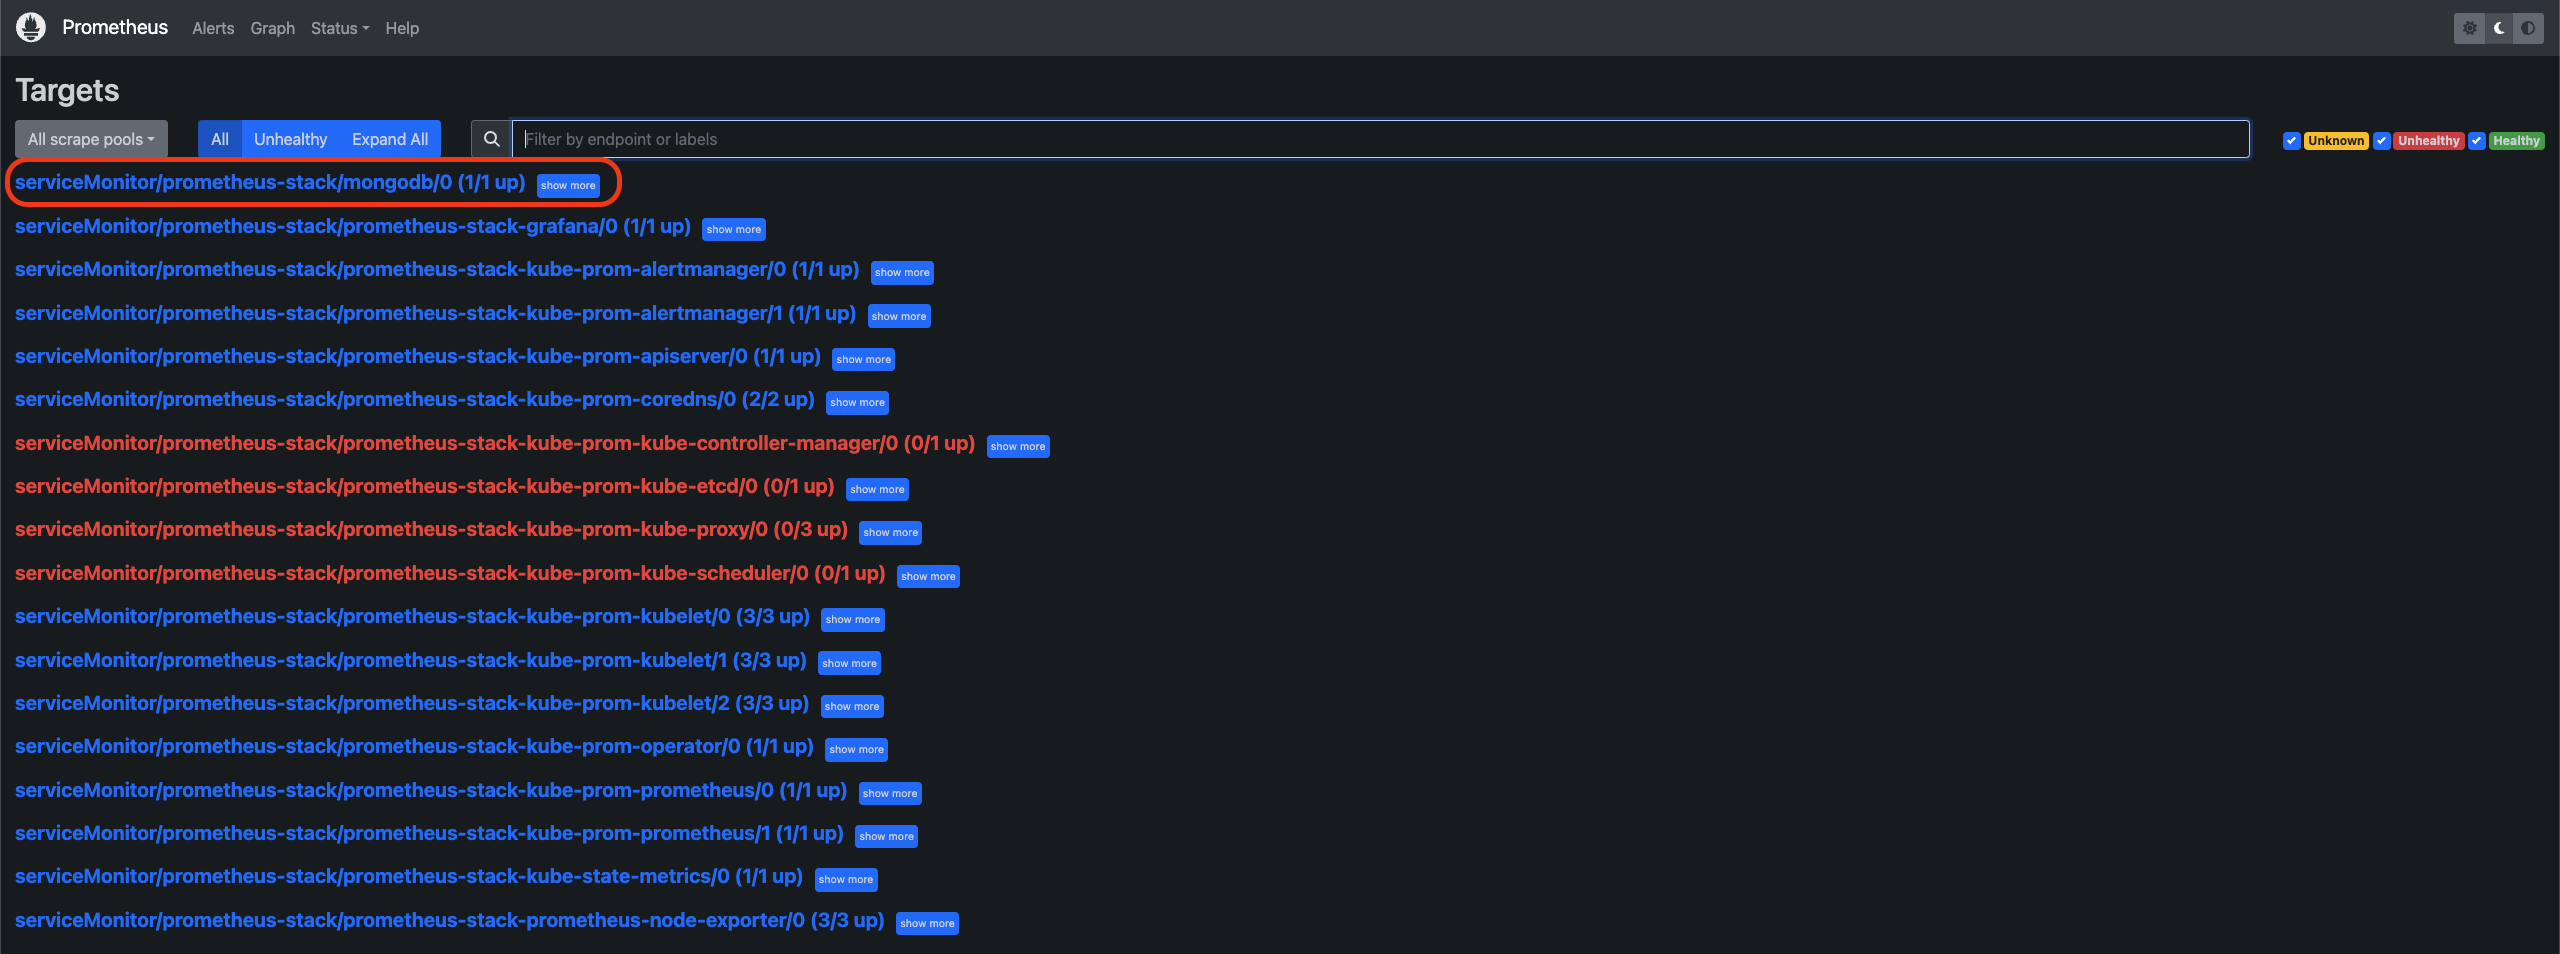
這樣就完成 MongoDB 與 Exporter 的實際部署。我們可以進到 Prometheus UI 確認 MongoDB Exporter 是否有自動成為 Prometheus 的 target:
建立 Grafana MongoDB Dashboard
Grafana 官方有提供使用者可以上傳客製化的 Dashboard,也有應用程式開發方會上傳建議使用的 Dashboard,相當方便。因為前面已經建立了 MongoDB Exporter,這邊就以官方提供的 Dashboard ID 直接建立��對應的 Dashboard 來觀察 MongoDB 的情形。
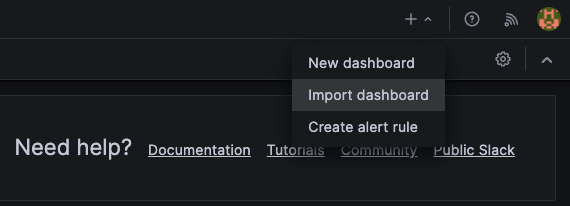
- Grafana 首頁右上角點選 Import Dashboard
- 輸入 Dashboard ID
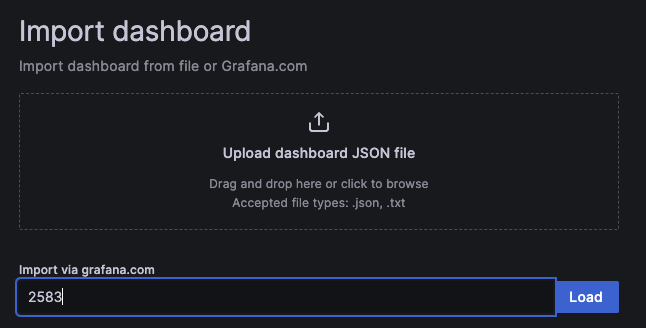
- 選取資料來源為 Prometheus
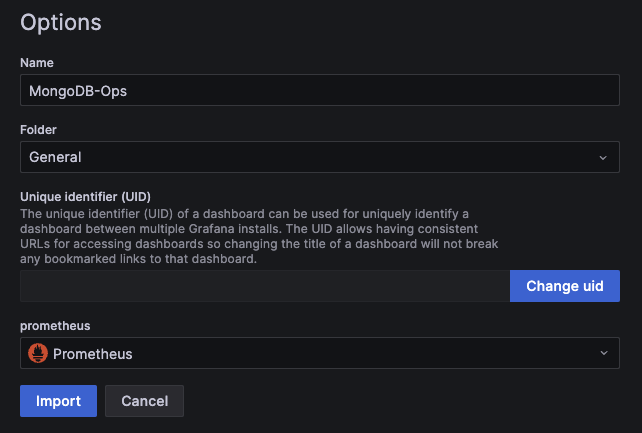
- 完成匯入 Dashboard
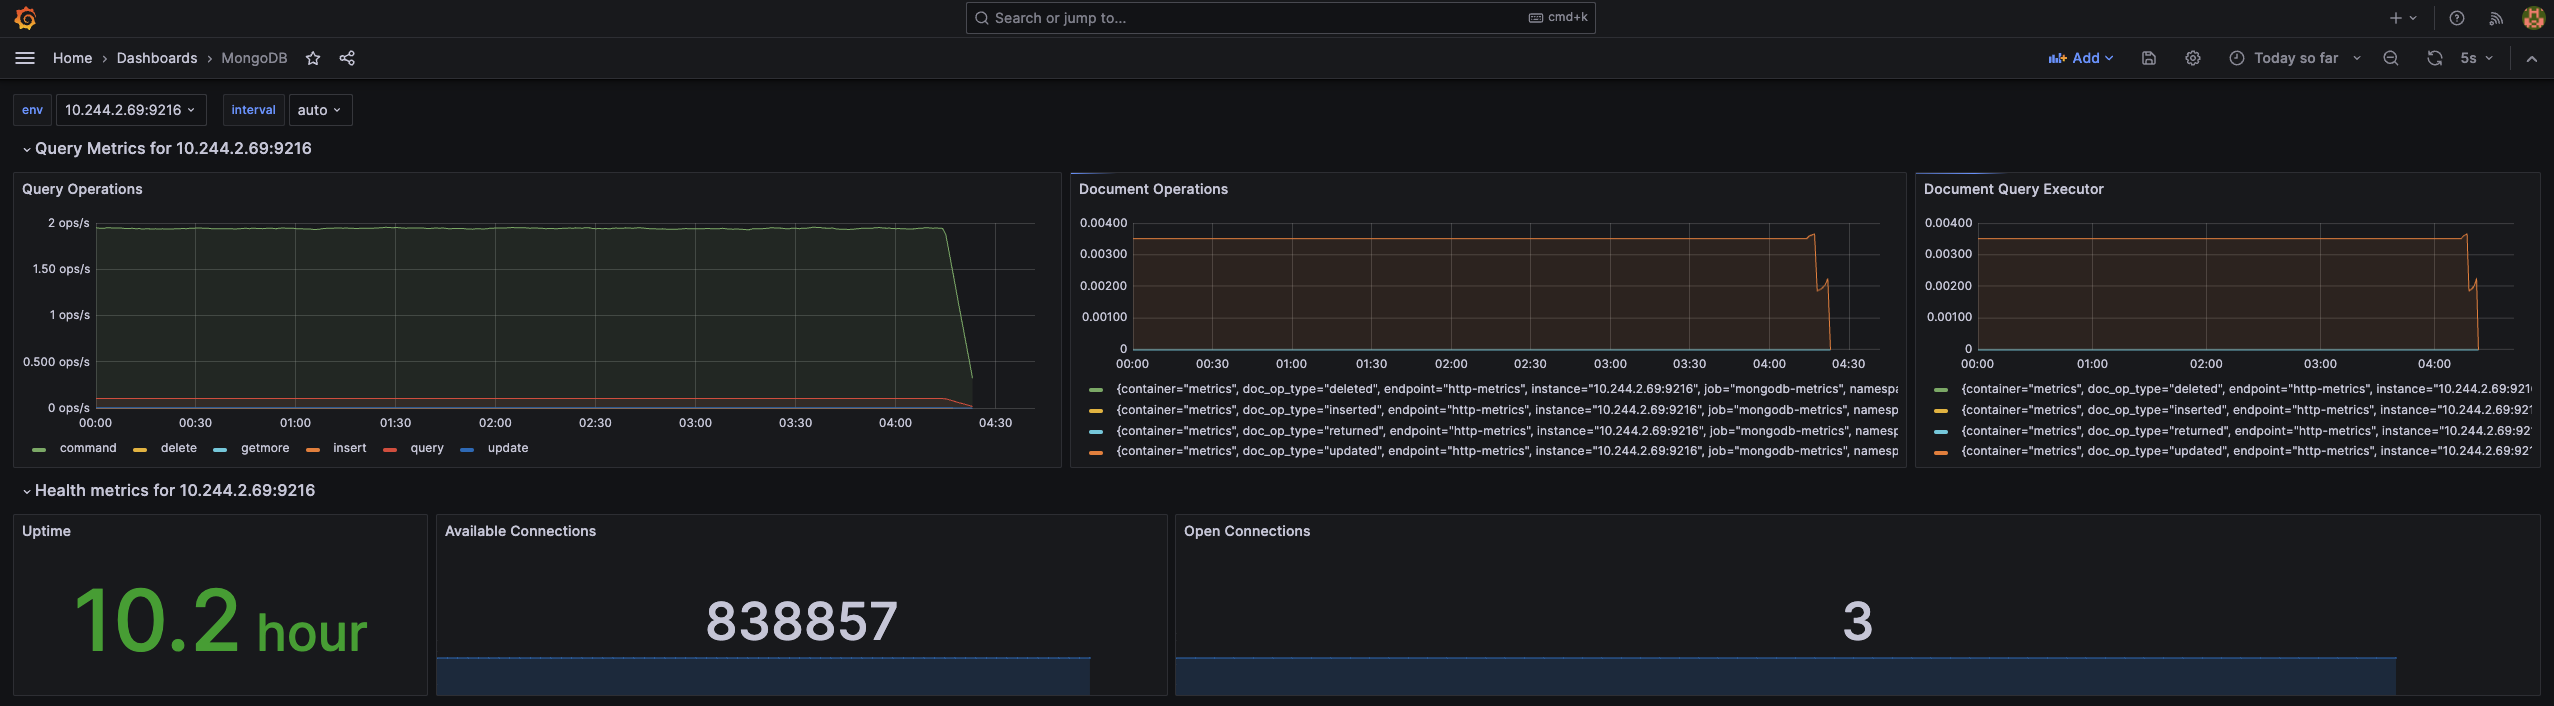
上述僅提供了最簡單建立 Dashboard 的方法,實際上可以根據應用程式的特性去撰寫 PromQL 客製化適合使用的 Dashboard。
總結
Prometheus 提供了最基礎的監控措施,且有相當多的第三方套件或函式庫可搭配使用,以生態系來說相當好上手,比較少有 Prometheus 做不到的監控場景,加上 Grafana 的快速發展,基於 Prometheus 的生態系與工具越來越完整;但實務上除了建立監控的 infrastructure,更重要的是如何建立所謂的可觀測性,了解在監控什麼、為何而監控應該是更需要花時間去研究的部分。